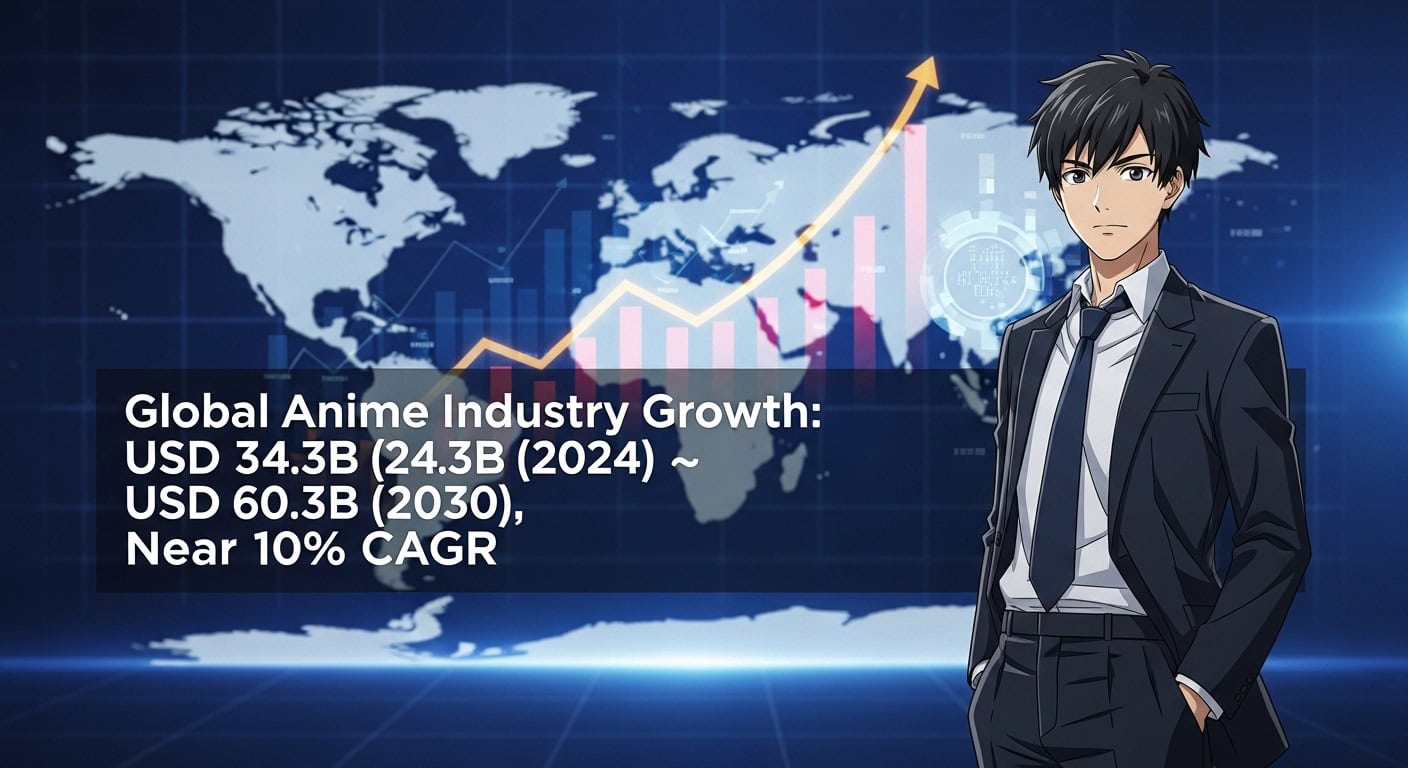
The global anime sector reached USD 34,256.2 million in 2024 and could hit USD 60,272.2 million by 2030, driven by a near 10% CAGR. This remarkable growth trajectory reflects not only the increasing popularity of anime across various demographics but also the expanding global market, which now includes a diverse range of genres and formats appealing to audiences worldwide. Our AI anime market research highlights how artificial intelligence is revolutionizing the industry, from production and storytelling to marketing and audience analytics. Factors such as the rise of streaming platforms, international collaborations, and the integration of advanced technologies in production and distribution are pivotal in shaping this landscape, creating new revenue streams and opportunities for creators and investors alike.

This report previews why that scale matters to studios, platforms, retailers, and investors in the United States. The opportunity spans merchandising, licensing, live events, and streaming deals that boost reach and revenue.
Smarter production and data-driven distribution now let teams push content faster and measure ROI more precisely. Leaders like Crunchyroll, Discotek Media, and Bioworld show how app launches and acquisitions reshape the space.
Our analysis answers core questions: current market size, projected growth through 2030, top revenue segments, and where demand accelerates next. We also point to practical moves—budget allocation, partnership targets, and validation with verifiable numbers.
Bottom line: rising fan engagement and platform access create high growth. Early adopters who combine technology with a clear strategy can capture scale and lasting value.
Executive Summary: Market Size, Growth Rate, and What Businesses Need to Know
Decision-makers need a concise snapshot of size, share, and trajectory to plan budgets and deals. This report frames the key numbers and what they mean for product pipelines, distribution, and partnerships.
Headline figures: global market size was USD 34,256.2M in 2024, rising to USD 37,698.9M in 2025, and projected to reach USD 60,272.2M by 2030. That path implies a 9.8% CAGR from 2025–2030, outpacing many entertainment categories and signaling robust audience demand.
Where share concentrates: merchandising held 31.6% in 2024, and action & adventure claimed 34.3% by genre. Internet distribution shows the fastest CAGR at 13.8%, while sci‑fi & fantasy is the quickest-growing genre.
Why the 2025–2030 forecast period matters: it covers critical hiring, acquisition, and content cycles. The U.S. outlook (roughly 16% CAGR) raises the bar for localization, simulcasts, and platform deals.
- Use data-driven greenlighting and distribution sequencing.
- Balance share leaders with fast-growth segments to reduce revenue volatility.
- Scenario plan for demand shifts across digital, physical, and live channels.
Methodology and Scope of This Industry Report
Core approach: We combined historical revenue series with qualitative signals to create practical projections. The dataset covers 2018–2023 as the historical baseline, uses 2024 as the base year, and applies a 2025–2030 forecast period aligned with content cycles and licensing timelines.
Data coverage and segmentation
The analysis breaks the industry into three dimensions: type (TV, Movie, Video, Internet Distribution, Merchandising, Music, Pachinko, Live Entertainment), genre (Action & Adventure, Sci‑Fi & Fantasy, Romance & Drama, Sports, Others), and geography (North America, Europe, Asia Pacific, Latin America, Middle East & Africa).
How estimates are derived
Revenue and share estimates use historical USD figures and observed CAGR trends to forecast to 2030. We model scenarios that incorporate distribution shifts, platform deals, and audience behavior changes.
- Region-level granularity uses local revenue series and exchange-adjusted USD reporting.
- North America, Europe, and the Asia Pacific receive extra focus due to scale and influence.
- Comparability is maintained via USD revenue and CAGR units across segments.
| Dimension | Primary Units | Business Use |
|---|---|---|
| Type (TV, Movie, Internet, Merch.) | USD million / CAGR | Budgeting, distribution strategy |
| Genre (Action, Sci‑Fi, Romance) | Revenue share (%) | Greenlighting, marketing, merchandising |
| Region (NA, EU, APAC) | USD revenue / CAGR | Localization, licensing, platform deals |
Decision intent: This framework blends quantitative data with trend analysis to highlight current share leaders and the fastest-growing segments. That dual view helps teams allocate resources, set roadmaps, and reduce execution risk during the forecast period.
Global Anime Market Size and Growth Trajectory
USD 34.26B in 2024 grows to USD 60.27B by 2030 under a 9.8% CAGR, creating a larger and more accessible industry for studios, platforms, and brands.
From 2024 valuation to 2030 projection: USD 34.26B to USD 60.27B
The revenue arc shows steady compounding. That growth raises the long-term potential for both incumbents and new entrants.
Compound growth widens the opportunity for catalog investment and new originals that can scale across regions and formats.
Drivers behind a 9.8% CAGR: social media, streaming, and merchandise
Social platforms boost discovery and fandom, turning attention into subscriptions, box office, and product sales.
Streaming platforms accelerate reach with fast localization, simulcasts, and curated catalogs that widen audience funnels and increase revenue.
Merchandise momentum links directly to strong franchises: engaged communities extend the life of IP and create long-tail sales.
- Improved animation technology raises quality and throughput, enabling more releases without sacrificing standards.
- Data feedback from platforms and retailers tightens content and marketing strategies to match real-time demand.
- Growth is diversified across digital distribution and physical categories, which lowers single-channel exposure.
Strategic takeaway: invest where engagement converts to predictable revenue streams—platform distribution, community activation, and catalog-plus-originals approaches deliver the best return during this forecast period.
Segmentation Deep Dive: Type, Genre, and Revenue Mix
A focused look at type and genre uncovers the revenue engines that power franchise growth.
The type breakdown shows merchandising leading with a 31.6% share in 2024. Physical goods and licensed apparel deliver steady cash flow and high gross margins, which explains the size of this segment.
Type Outlook and digital pressure
Internet distribution posts the fastest CAGR (13.8%) from 2025–2030. Frictionless access, deeper catalogs, and better discoverability on platforms drive this growth.
Genre split and growth pockets
Action & Adventure holds a 34.3% share by appeal to broad demographics. Sci‑Fi & Fantasy accelerates fastest as tech-enabled storytelling and cross-media tie-ins expand reach.
| Channel | Why it earns | Growth driver |
|---|---|---|
| Merchandising | Recurring sales, licensing | Conventions & partnerships |
| Internet distribution | Subscription & ad revenue | Catalog & discoverability |
| Live experiences | Tickets, VIP sales | Fandom activation |
- Localization, subtitling, and dubbing improve conversion across regions.
- Coordinated release calendars align inventory and promotional peaks.
- Partnerships with gaming and fashion scale audience and long-term value.
Decision checklist: prioritize types that balance near-term revenue with franchise building—merchandise for cash flow, internet distribution for reach, and live events for lifetime value.
Regional Insights: Where Demand and Revenue Will Accelerate Next
Regional demand is shifting fast, and each territory now needs a tailored growth playbook. Smart entrants match content, pricing, and partner models to local behavior to capture upside during the 2025–2030 forecast.
Asia Pacific leadership and why it matters
Asia Pacific held a 27.09% revenue share in 2024, led by mobile-first consumption, streaming adoption, and gaming tie-ins. Local originals, along with licensed international titles, keep audiences engaged across all services.
North America: fastest growth window
North America is set to grow fastest (~16.3% CAGR). That speed shortens competitive timelines and raises marketing costs. Global players must accelerate catalog localization and simulcast deals to win subscribers and retail sales.
Europe’s steady climb and local service play
Europe shows an 11.2% CAGR driven by dubbing, distributor partnerships, and mainstream retail integration. Regional strategies that prioritize localized services and event activations convert curious viewers into buyers.
- Pricing & windowing: platform mixes influence subscription tiers and release windows.
- Demand drivers: mobile behavior in APAC, live event culture in Europe, and scaled promotions in North America.
- Regulation: content approvals and data rules affect ad models and targeting.
Practical staging: launch with local partners, test assortments, then scale. Use co-marketing to cut CAC and time investments to the forecasted revenue peaks.
United States Focus: Streaming, Technology, and the 16%+ Growth Outlook
The United States represents a high-growth frontier where streaming platforms and tech improvements reshape distribution. U.S. demand is on track for roughly a 16% CAGR from 2025–2030, which outpaces the global average and signals an outsized opportunity for well-positioned entrants.

U.S. growth drivers
Platform deals and co-productions speed access to large audiences and broaden catalog share across services. Licensing agreements shorten time-to-revenue for studios and boost visibility for titles.
Simultaneous releases and fast localization capture social conversation and cut piracy. Quick dubbing and captioning make titles discoverable and keep engagement high.
Opportunities for studios, distributors, and brands
Technology investments—from modern rendering to automation—improve unit economics and allow studios to scale quality without linear cost increases.
- Studios win with targeted genre bets, eventized releases, and companion merchandise that match U.S. audience cycles.
- Distributors can optimize theatrical windows, home video runs, and digital bundling to lift lifetime value.
- Brands benefit through experiential tie-ins, apparel capsules, and creator-led collaborations that convert fans into customers.
| Stakeholder | Priority | U.S. specific tactic |
|---|---|---|
| Studios | Quality + speed | Invest in localization teams |
| Distributors | Windowing | Staggered theatrical + premium digital |
| Brands | Activation | Conventions and influencer drops |
Practical tips: push for analytics-driven revenue shares in negotiations, test short exclusives to grow subscribers, and meet accessibility standards for wider reach. These moves help convert U.S. growth into lasting commercial value.
The Role of Streaming Platforms in Market Expansion
Streaming services now set the tempo for global release strategies and subscriber growth. Simultaneous releases and curated windows reduce regional lag and keep fans engaged during peak moments.
Distribution shift: simulcasts, exclusives, and subscription growth
Simulcasts align global fandoms. They boost conversion when episodes drop and social buzz spikes.
Exclusives and originals help platforms stand out. Exclusive shows increase retention and lift ARPU through tiered plans.
How platform partnerships amplify diversity and revenue
Joint projects with Japanese studios create hybrid titles and faster localization. These partnerships scale marketing and improve quality control.
- Revenue levers: AVOD/SVOD tiers, bundles, and transactional windows to raise ARPU.
- Catalog curation: balance classics with new series to serve core fans and newcomers.
- Data-driven discovery: recommendation engines extend long-tail consumption and help rights holders earn ongoing share.
KPIs to track: completion rates, trial-to-paid conversion, cohort retention, and merchandise attach rates. These metrics tie platform performance to downstream revenue and future forecast decisions.
Generative AI in Animation: The Next Growth Engine
Generative tools are changing production economics and creative workflows for studios and brands. Forecasts show growth from USD 652.1M in 2024 to USD 13,386.5M by 2033 at a 39.8% CAGR. This expansion will reshape how content is made and monetized.
Adoption, models, and regional leadership
North America led adoption in 2024 with a 33.4% share. Transformer-based models hold roughly 40.9% of tool usage and drive rapid gains in motion consistency and style transfer.
Studio and advertiser workflow wins.
Studios see clear productivity gains: faster prototyping, compressed timelines, and consistent output quality at scale. Advertisers benefit from dynamic creatives and faster iteration for personalized animated spots.
- Practical use cases: auto-rigging, lip-sync, background generation, and AI-assisted storyboarding.
- Indie teams and gaming creators can produce cutscenes and trailers without heavy pipelines.
- Quality guardrails include human-in-the-loop review and IP protection workflows.
| Metric | Pre-generative | Post-generative |
|---|---|---|
| Hours per minute of animation | 200–400 | 40–120 |
| Cost per asset | $1,500–$8,000 | $200–$1,200 |
| Prototype velocity | Weeks | Hours–Days |
| Top adopters | Large studios, VFX houses | North America tech vendors, mid-size studios, indie teams |
Adoption roadmap: start with pilots that attach clear KPIs (cost per asset, test velocity, quality score). Move to production when tools hit defined thresholds and human review is embedded.
Bottom line: generative animation technology unlocks new economics for content owners, speeds creative testing, and widens participation across studios, gaming teams, and advertisers. Careful governance keeps quality and IP intact while scaling growth.
Competitive Landscape and Key Companies to Watch
A fast-moving competitive field now shapes who earns share and who scales first.

Map the landscape: streaming platforms, major studios, distributors, and merch partners each control different levers of growth.
Streaming, studios, and merch leaders
Crunchyroll pairs a deep catalog with new app features that boost engagement and cross-sell services. Studio Ghibli and Toei move seasonal demand with tentpole releases. Bioworld strengthens retail reach after recent acquisitions, lifting merchandise share.
Emerging participants in North America
Smaller companies such as Eleven Arts and Atomic Flare fill niches in distribution and licensing. They often act faster on boutique releases and specialty retail deals.
Recent developments shaping 2025
App launches and catalog moves change distribution leverage. Crunchyroll’s manga app (Jan 2025), Discotek’s new releases (Aug 2024), and Bioworld’s Packed Party deal (Jul 2024) illustrate how services and acquisitions alter data ownership and shelf visibility.
- Partner criteria: fast localization, flexible rights, and measurable marketing lift.
- Watch signals: new IP, cross-media deals, and large retail partnerships.
- Event cues: major convention slates often predict seasonal demand and co-marketing timing.
| Company Type | Core Strength | Effect on Share | 2025 Signal |
|---|---|---|---|
| Streaming (Crunchyroll) | Catalog + app ecosystem | Higher engagement, cross-sell | Manga app launch expands services |
| Studios (Toei, Ghibli) | Production capacity, IP | Seasonal box office + licensing | Major slates drive peaks |
| Merchandising (Bioworld) | Retail footprint, licensing | Recurring revenue, retail share | Acquisition increases shelf reach |
| Indie distributors | Niche releases, speed | Local share gains in specialty segments | Catalog refreshes and limited runs |
Quick tip: build partnerships that combine fast localization, retail placement, and platform data. That lowers distribution risk and speeds go-to-market.
ai anime market research: Data-Backed Trends, Market Share, and Opportunities
Cross-media tie-ins are reshaping who wins share across platforms and retail channels.
Cross-media integration—gaming collaborations, fashion capsules, and live events—drives visibility and repeat spending. Partnerships with brands like Uniqlo and Gucci lift merchandise sales and broaden demographics.
Cross-media integration: gaming, fashion, and live events
Gaming tie-ins extend storylines and create in-game purchasables that boost franchise lifetime value. Fashion drops and limited editions create scarcity and press attention.
Live concerts and expos convert fans into high-margin buyers and deepen community ties. These events also raise streaming viewership and subscription conversion.
Monetization across segments: from licensing to digital commerce
Licensing, D2C drops, and premium platform tiers stack to raise ARPU. Digital commerce and timed drops improve sell-through and let rights holders test price elasticity.
| Channel | Primary Revenue | Key KPI |
|---|---|---|
| Gaming tie-ins | In-game purchases, cross-sales | Engagement minutes, attach rate |
| Fashion capsules | Limited apparel, collaborations | Sell-through %, resale value |
| Live events | Tickets, VIP packages | Revenue per attendee, repeat rate |
- Regional strategies tailor drops and events to local demand and spending habits.
- Creators and influencers accelerate discovery and drive rapid conversion.
- Measure cross-media ROI by tracking halo effects on subscriptions and merchandise lift.
Recommendation: structure partnerships that protect IP, set clear revenue shares, and use limited runs plus direct channels to maximize both reach and margin.
Forecast Period Outlook: 2025-2030 Strategic Moves
Over the 2025–2030 forecast period, clear tactical moves separate fast growers from stalled competitors. This period rewards teams that pair distribution reach with tighter production controls and smart genre bets.
Investment priorities
Prioritize internet distribution first: it posts the fastest CAGR (13.8%) for 2025–2030 and drives scale in subscriptions and ad revenue.
Back fast-rising genres such as sci‑fi & fantasy with targeted IP and marketing. These genres show the strongest audience traction and cross-media upside.
Phase technology-enabled production pilots to cut costs and improve throughput without harming creative quality.
Risk factors and hedges
Key risks include regional shifts in demand, rising production costs, faster but lower-quality output, and IP saturation.
- Diversify release windows across territories to reduce single-region exposure.
- Use flexible licensing terms to shift risk and capture upside as titles perform.
- Build quality gates into production pipelines to catch defects before scale.
| Priority | Action | KPI | Timing |
|---|---|---|---|
| Internet distribution | Expand catalog, localize, test tiers | Trial-to-paid %, completion rate | 0–12 months |
| Production tech | Pilot tools, human review gates | Defect rate, hours/min | 6–24 months |
| IP portfolio | Mix anchors + experiments | Engagement-to-purchase, LTV | 0–36 months |
Staffing and vendors: hire localization leads, data analysts, and rights managers. Use trusted vendors for rapid dubbing and QA to meet U.S. and European windows.
24–36 month roadmap: 1) Pilot distribution and production tech (0–12 months). 2) Scale successful pilots and co-productions (12–24 months). 3) Expand cross-media partnerships and global windows (24–36 months). Track on-time delivery, defect rates, engagement-to-purchase, and territory CAC to guide capital allocation through the forecast period.
Conclusion
Final takeaway: leaders that pair scale distribution with quality production will capture the most upside as the market grows from USD 34.26B to USD 60.27B by 2030 at a 9.8% CAGR.
Asia Pacific keeps the largest share today, while North America offers the fastest acceleration. Use that split to guide expansion and local investment.
Generative tools reshape animation economics and speed testing. Invest in pilots but keep human review to protect IP and quality.
Focus near-term on internet distribution, top genres, and merchandise. Track release slates, platform deals, and cross-media tie-ins closely.
Use this report’s analysis to stress-test assumptions, align teams, and build resilient portfolios that balance proven IP with experimental bets.